Hotel management question
What Is Hotel Flow-Through? Formula, Examples and How to Interpret It
Calculate hotel flow-through at departmental and GOP level, see a reconciled hotel example, and learn how to interpret upside, downside and contradictory revenue-profit movements.
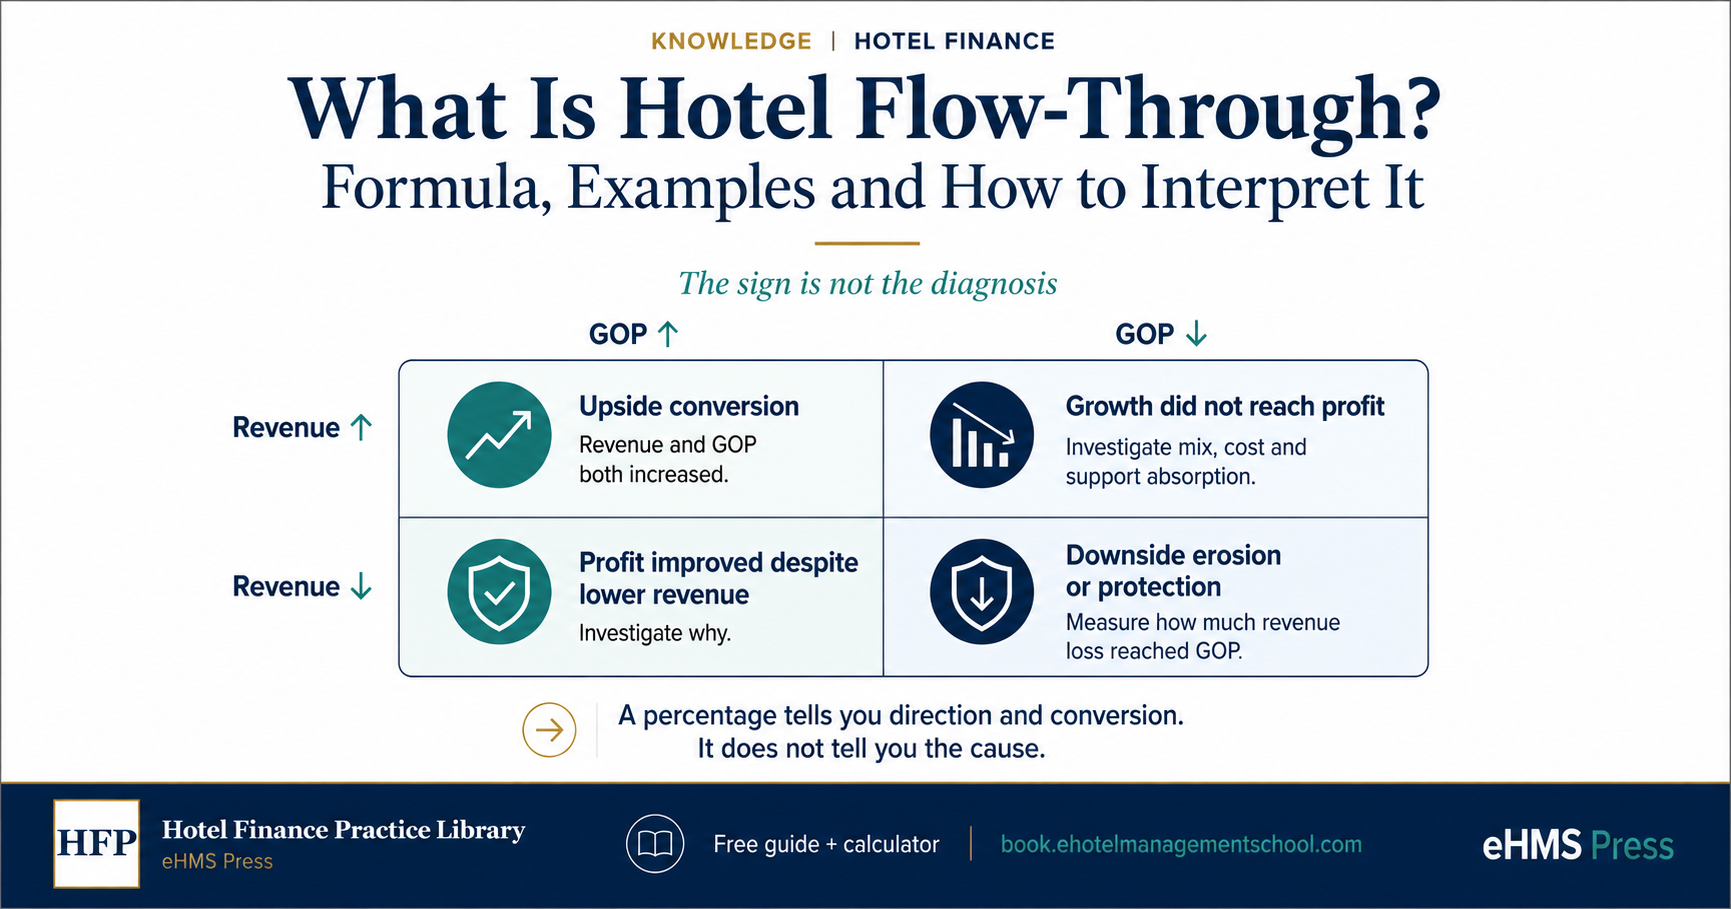
Hotel flow-through measures how much of a change in revenue becomes a change in contribution or profit. The ratio is useful only when the comparison basis is consistent and the direction is understood: revenue up/GOP up, revenue down/GOP down, or revenue and GOP moving in opposite directions can produce very different management meanings. Use flow-through as a conversion signal that directs the next investigation, not as a universal performance grade.
Hotel flow-through formula
At hotel level, a useful measure is:
GOP Flow-Through = Change in GOP before management fees ÷ Change in Total Operating Revenue
If revenue increases by $500,000 and GOP increases by $200,000, GOP flow-through is 40%. In an upside case, management can say that about 40 cents of each incremental revenue dollar reached GOP.
Hotels can measure conversion at more than one level:
| Measure | Formula | Management question |
|---|---|---|
| Departmental Flow-Through | Change in Departmental Contribution ÷ Change in Department Revenue | How much of the department's revenue movement reached departmental contribution? |
| GOP Flow-Through | Change in GOP before management fees ÷ Change in Total Operating Revenue | How much of the hotel's revenue movement reached operating profit? |
| Fee-Adjusted Flow-Through | Change in the approved after-management-fee operating result ÷ Change in Total Operating Revenue | How much remained after the applicable management-fee layer? |
Calculate these only when the revenue change is non-zero and the comparison periods use a consistent basis. The three percentages are not interchangeable because each measures conversion at a different point in the operating-profit waterfall.
Where a property uses IBNOIE or another approved label for the result after qualifying management fees, use that approved terminology. Do not simply rename the result GOP, EBITDA or cash flow.
Worked example: Azure City Resort
The Azure City Resort figures below are synthetic teaching data from Hotel Budgeting and Forecasting in Practice. They are designed to demonstrate reconciliation and are not hotel benchmarks.
| Operating layer | Prior year | Budget | Change |
|---|---|---|---|
| Total Operating Revenue | $10,484,812 | $11,483,638 | +$998,826 |
| Departmental Contribution | $6,203,000 | $6,829,000 | +$626,000 |
| Undistributed Operating Expenses | $3,133,000 | $3,250,000 | +$117,000 |
| GOP before management fees | $3,070,000 | $3,579,000 | +$509,000 |
| GOP margin | 29.3% | 31.2% | +1.9 pp |
| Operating result after management fees | $2,755,456 | $3,191,042 | +$435,586 |
The first conversion is departmental:
$626,000 ÷ $998,826 = 62.7% Departmental Flow-Through
So 62.7% of the incremental operating revenue reached Departmental Contribution.
Undistributed Operating Expenses then increased by $117,000. GOP therefore improved by $509,000:
$509,000 ÷ $998,826 = 51.0% GOP Flow-Through
The management-fee bridge reduced the after-fee improvement to $435,586:
$435,586 ÷ $998,826 = 43.6% Fee-Adjusted Flow-Through
Those three results tell different stories. Departmental conversion was 62.7%; hotel-level conversion to GOP was 51.0%; after the contract-driven fee layer, conversion was 43.6%. The difference directs the next review: departmental economics, support-cost absorption, or fee treatment.
Do not stop at the percentage. Follow the movement through the P&L and identify where the additional value was retained or absorbed.
Department mix can hide behind the headline
Azure's department-level teaching split shows why one hotel-wide percentage can hide very different economics:
| Department | Revenue change | Contribution change | Flow-through |
|---|---|---|---|
| Rooms | +$668,826 | +$540,000 | 80.7% |
| F&B outlets | +$200,000 | +$30,000 | 15.0% |
| Banquet / MICE | +$70,000 | +$30,000 | 42.9% |
| Other operated departments | +$60,000 | +$26,000 | 43.3% |
| Total | +$998,826 | +$626,000 | 62.7% |
The correct response is not to rank departments by percentage alone. Rooms may be rate-led or workload-led; F&B may be affected by product cost, labour, menu mix or event economics; other departments may have very different direct-cost structures. The percentages tell management where to look next. They do not prove the cause.
Four flow-through situations managers often misread
The examples in this section are editorial teaching illustrations created for this article. They are not book cases or hotel benchmarks.
| Situation | Revenue change | GOP change | Mathematical ratio | First interpretation |
|---|---|---|---|---|
| Revenue ↑ / GOP ↑ | +$100k | +$40k | 40% | 40% of incremental revenue reached GOP |
| Revenue ↓ / GOP ↓ | -$100k | -$35k | 35% | GOP erosion equalled 35% of the revenue decline |
| Revenue ↓ / GOP ↑ | -$100k | +$20k | -20% | GOP improved despite lower revenue |
| Revenue ↑ / GOP ↓ | +$100k | -$20k | -20% | Growth did not reach GOP |
Notice that the last two cases both produce -20% mathematically, but they describe opposite business situations. The sign of the percentage is therefore not the diagnosis.
Revenue increases and GOP increases
This is the conventional upside-conversion case. A 40% result means that 40% of the incremental revenue reached GOP. The next questions are what type of revenue increased, what additional costs should have followed it, and whether any labour, channel or capacity threshold was crossed.
Revenue falls and GOP falls less
If revenue falls by $100,000 and GOP falls by $35,000, the ratio is 35%. A clearer management statement is: GOP erosion equalled 35% of the revenue decline.
The hotel protected $65,000 of the revenue reduction from reaching GOP through lower costs or offsetting movements. That may be healthy if commissions, laundry, guest supplies, casual labour or product cost flexed correctly. It may be misleading if the apparent protection came from deferred maintenance, frozen recruitment, delayed marketing, a one-off credit or expenditure shifted into another period.
The next question is: Was the profit protection operationally healthy and repeatable?
Revenue falls but GOP increases
If revenue falls by $100,000 while GOP improves by $20,000, the formula produces -20%. It would be wrong to read that negative sign as an automatic failure.
Possible explanations include healthier revenue mix, lower channel acquisition cost, genuine labour flex, procurement improvement or the removal of low-margin business. Less attractive explanations include deferred maintenance, unfilled necessary vacancies or expenditure moved into a later month.
The useful conclusion is: Revenue declined while GOP improved. Investigate whether the improvement came from healthier mix and productivity or from temporary, deferred or non-recurring cost movements.
Revenue increases but GOP falls
If revenue rises by $100,000 but GOP falls by $20,000, the ratio is also -20%—but now the hotel generated more revenue and less operating profit.
Possible causes include expensive OTA growth, discounting, overtime, a labour step-cost threshold, weak F&B contribution, support-cost growth, deliberate investment or one-off operating costs. Do not jump straight to an across-the-board cost cut. Ask what changed first and why the incremental business failed to reach GOP.
The sign of the percentage is not the diagnosis
A useful monthly review can use this directional matrix:
| Revenue | GOP | First interpretation |
|---|---|---|
| ↑ | ↑ | Measure upside conversion |
| ↓ | ↓ | Measure downside GOP erosion / protection |
| ↑ | ↓ | Growth did not reach GOP — investigate |
| ↓ | ↑ | Profit improved despite lower revenue — investigate why |
| ≈ unchanged | material movement | Flow-through may not be the right diagnostic |
Why there is no universal hotel flow-through target
Different revenue streams create different economics.
An ADR increase on rooms that would have been sold anyway may require relatively little additional operating cost. Occupancy-led Rooms growth can create more housekeeping workload, laundry, room supplies, breakfast consumption, utilities, payment charges and commissions. OTA-led growth can convert differently again because acquisition cost changed.
Additional F&B revenue may require product cost, kitchen labour, service labour, casual staff, linen, utilities, event setup and cleaning. Spa, transport, parking, recreation, retail and partner income can each have different direct-cost, labour and capacity consequences.
Build the economics first. Calculate and interpret the conversion after the operating drivers are visible.
When flow-through can mislead you
1. The comparison periods are inconsistent
If definitions, capacity, closures, packages, gross-versus-net treatment, ownership model or service scope changed, the calculation may be precise but unsafe.
2. Revenue barely changed
A very small revenue movement can create an extreme percentage. If revenue changes by only +$10,000 while GOP changes by -$50,000, the formula produces -500%. The arithmetic is correct, but management will usually learn more by investigating the $50,000 GOP movement directly than by debating the ratio.
3. Revenue mix changed
An additional $100,000 of ADR-led Rooms revenue does not have the same economics as $100,000 of discounted OTA occupancy or banquet revenue.
4. The hotel crossed a cost threshold
Some costs move smoothly; others move in steps. Additional business may require another shift, employee, outsourced service, equipment or other capacity.
5. A strong result came from deferred work
High flow-through is not automatically good management if the hotel achieved it by postponing necessary maintenance, safety work, recruitment, training, marketing or operating supplies.
6. The operating model is different
A rooms-only select-service hotel and a managed resort can both be well run while producing materially different GOP margins and expected conversion. Property type, service scope, season, revenue mix, ownership structure and deliberate investment all matter.
How to use flow-through in a monthly hotel review
- Identify what changed in revenue. Rate, occupancy, channel, covers, average spend, events or mix?
- Understand what cost should have moved. Variable, fixed, mixed, step or committed?
- Calculate the relevant conversion. Departmental, GOP or fee-adjusted?
- Check the direction. Are Revenue and GOP moving together or in opposite directions?
- Open the layer that absorbed the movement. Department, distribution, labour, support cost, fees or one-off item?
- Identify what management can still influence. Find the operating lever rather than demanding a target percentage.
- Update the forward view. If the driver is recurring and supported by evidence, carry the revised expectation, action owner and next check into the latest forecast.
The arithmetic is easy. The value lies in the interpretation.
Calculate your hotel's flow-through
Use the eHMS Hotel Flow-Through & Flex Calculator to calculate your own comparison. The calculator currently supports the core calculation and will be upgraded to make the direction of Revenue and GOP explicit, flag unstable comparisons, and distinguish upside conversion from downside erosion.
For the broader diagnostic method, see How to Read a Hotel P&L Without Jumping to the Wrong Cause and How I Read a Hotel P&L: Stop Narrating the Numbers and Find the Real Driver.
Source basis and professional-use note
The formulas, Azure City figures and conversion bridge in this article are based on Hotel Budgeting and Forecasting in Practice, Chapter 21: GOP, Business Models, Management Fees, and Flow-Through Protection. The interpretation of cost behaviour and flow-through as a diagnostic signal is also supported by Hotel Operations Financial Playbook, Chapter 5: Costs Do Not All Behave the Same and Chapter 6: Flash, Forecast, Variance, and Action.
Azure City is synthetic teaching data. The four directional edge cases above are new editorial teaching illustrations for this article. None of these examples should be treated as a hotel benchmark.
Property reporting definitions, management agreements, approved accounting policy and governing professional guidance control live use.
Management takeaways
- Use flow-through as a conversion signal, not a universal performance grade.
- Distinguish Departmental, GOP and fee-adjusted flow-through because they measure different operating layers.
- Interpret the direction of Revenue and GOP before judging the percentage.
- Use edge cases to identify when a mathematically correct ratio may still be managerially misleading.
- Finish the review by locating where value was retained or absorbed and assigning the next management action.
Key concepts
- hotel flow-through
- Departmental Flow-Through
- GOP Flow-Through
- fee-adjusted flow-through
- downside conversion
- support-cost absorption
- revenue mix
- cost behaviour
- GOP
- denominator discipline